The Charts page displays data visually of the forms that are going through your office. This is important, so you can see and catch trends over a certain time period.
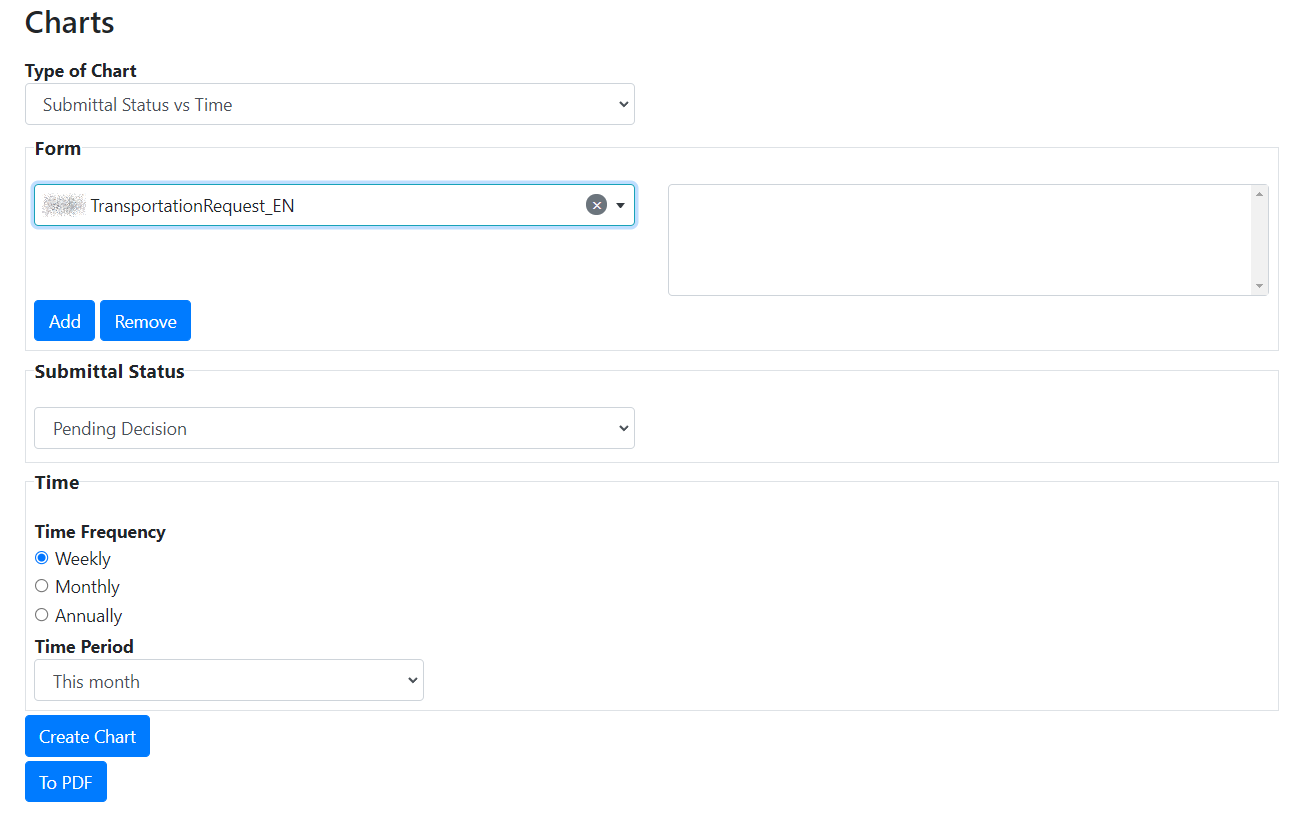
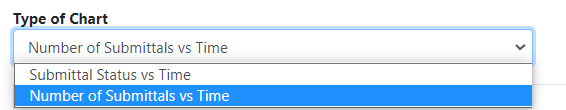
Step 1. Select the Type of Chart you would like to see either Submittal Status vs Time or Number of Submittals vs Time. Depending on the chosen chart step 2 and 3 will differ.
For Submittal Status vs Time:
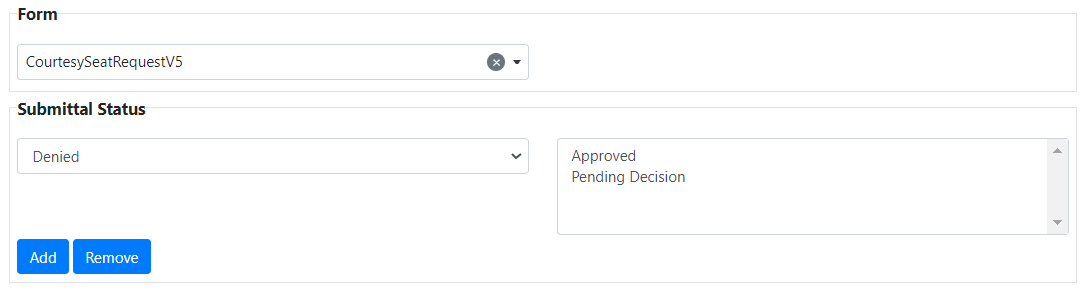
Step 2. Select the Form then Click Add. Note: You can select multiple forms to be added. To remove a form, select it from the box on the right then click Remove.
Step 3. Select the Submittal Status.
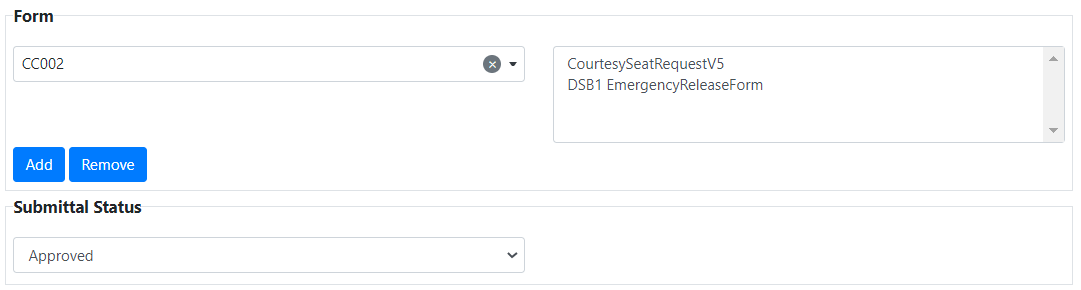
For Number of Submittals vs Time:
Step 2. Select a Form.
Step 3. Select the Submittal Status then click Add. Note: you can select multiple submittal status. To remove a submittal status, select it from the box on the right then click Remove.
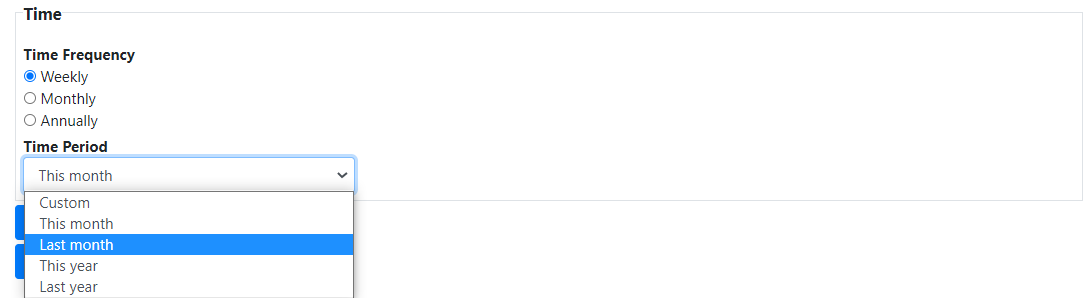
Step 4. Choose from the Time option what Time Frequency you would like to see in your chart.
Weekly: Displays the information in the chart over the course of a week.
Monthly: Displays the information in the chart over the course of a month.
Annually: Displays the information in the chart over the course of a year.
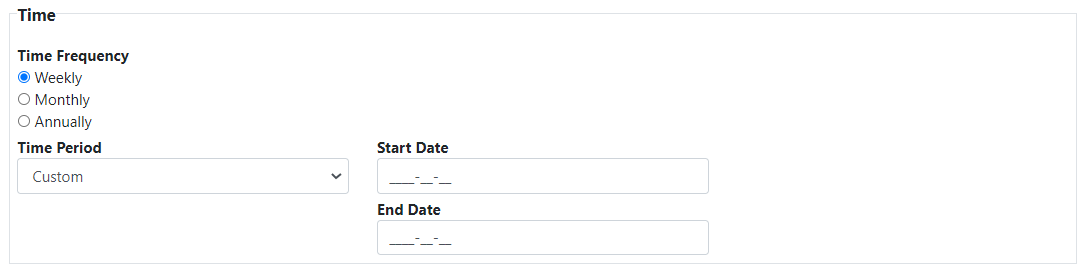
Next you can select which Time Period of information you would like your data to be selected from. You can select from a preset list or choose a customized time period.
Step 5. Click Create Chart to generate the chart. If you want to generate a PDF version of the chart click To PDF.